Statistics

Functional data analysis is the statistical analysis of samples of functions of one or more continuous variables (time, space, frequency). The data are realizations of random variables with values in infinite-dimensional spaces, which are however observed at a finite set of points of the domain. Research in this area deals with reconstructing functions (smoothing, alignment) and making inferences on the reconstructed functions (parameter estimation, group comparison, regression, prediction of a new curve, ...).
Keywords and topics covered:
Local inference, global inference, multiple testing, regression, alignment, Bayesian smoothing.
People involved:

Density-based /model-based clustering methods are advanced tools for identifying clusters in data. These methods are based on mixture models, which constitute the natural probabilistic framework for modeling heterogeneous populations. The estimation of the parameters is carried out by means of rigorous statistical approaches: on the one hand, by maximizing likelihood in the frequentist context; on the other hand, through the identification of the a posteriori distribution in the Bayesian context. These approaches not only guarantee an interpretable allocation, but also allow the uncertainty to be quantified. The research aims to develop methodological extensions for density-based clustering in complex scenarios, such as those involving contaminated or high-dimensional data, as well as in dynamic and temporal contexts.
Keywords and topics covered:
Model-based clustering, Bayesian clustering, Finite mixture models, Markov chain Monte Carlo, EM algorithm, Outliers detection, Robust estimation, Dynamic clustering
People involved:
Andrea Cappozzo, Federico Castelletti, Lucia Paci
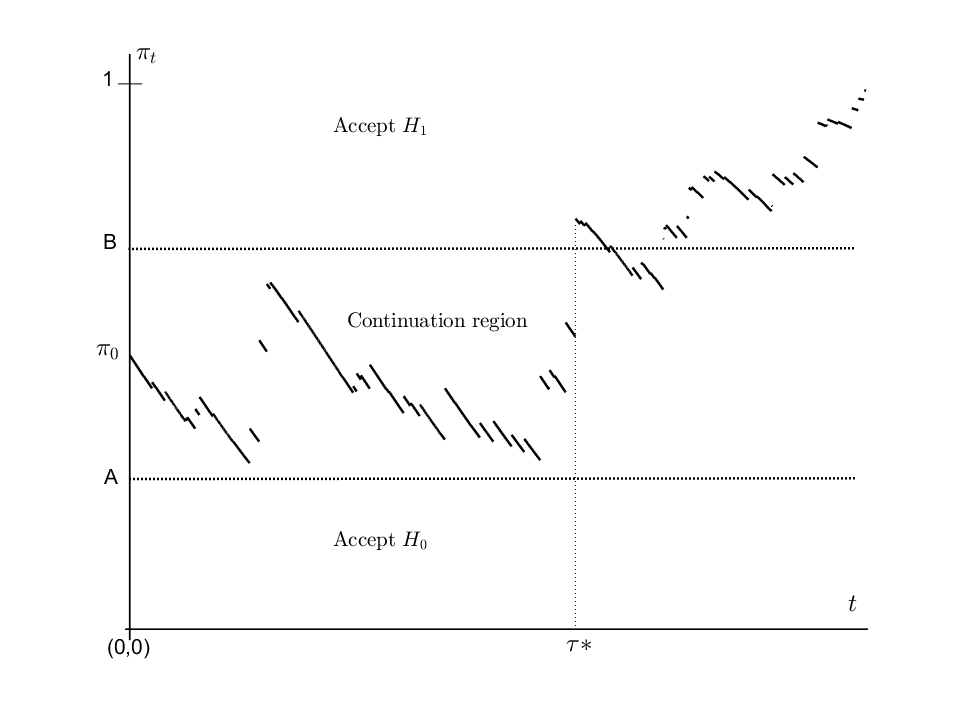
Sequential analysis is a branch of inferential statistics in which the number of observations is not fixed in advance. It formally began in the 1940s, when Abrahm Wald introduced the "sequential probability ratio test", a procedure for testing two statistical hypotheses based on sequential observation of data until there is evidence in favor of one of the two hypotheses. The main lines of research are: (1) construction of sequential tests for different types of stochastic processes and for a number of hypotheses greater than two; (2) analysis of "change-point detection" problems, where a process with certain initial statistical characteristics is monitored sequentially, possibly even within a predetermined period of time, to identify the moment in which these characteristics change.
Keywords and topics covered:
Optimal stopping; sequential testing; change-point detection or disorder problems; fraud detection; Brownian motion and Lévy processes; trading strategies; free-boundary problems; Numerical methods for sequential problems.
People involved:
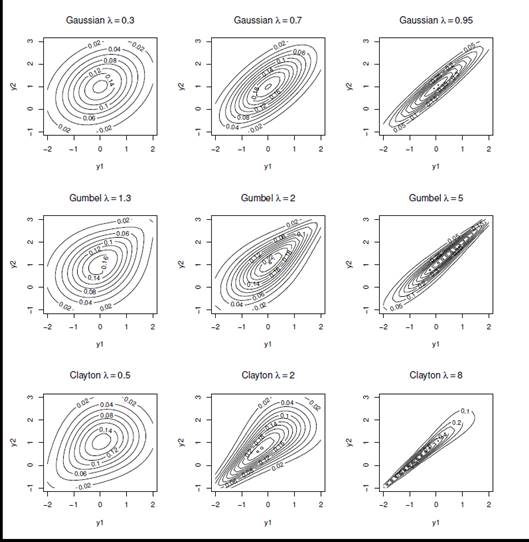
In statistics, copula is a useful tool that allows to easily model the dependence or association between two or more variables in the construction of multivariate distributions. Different copulas induce different types of dependence, from Gaussian copula that describes a linear link between variables to more complex copulas such as extreme value copulas that describe associations in the tails of distributions.
In the presence of two or more response variables, categorical, binary or detected on an ordinal scale, copulas are a useful tool to model the dependence between the probability of response in order to build models for the joint estimation of the risk of occurrence of complex, often rare and dependent events.
These models can be used in different areas: in the study of credit risk for the estimation of insolvencies, in the study of systemic risk and for the measurement of cyber risk, but also in the clinical setting in the joint study of the efficacy and toxicity of a drug.
Keywords:
Copulation, rare events, extreme events, models for ordinal variables, binary response variables, dependence, association, risk model and Cyber risk
People involved:
Silvia Facchinetti, Silvia Osmetti

Optimal design of experiments is a discipline that deals with planning data collection in such a way as to maximize the quality of the information obtained, while minimizing the cost, time and resources required. Its main objective is to choose the experimental conditions, i.e. the values of the independent factors, in order to optimize the accuracy of the estimates of the model parameters or the effectiveness of the predictive capabilities of the model. In general, the research on the design of experiments - developed both in the frequentist and Bayesian fields - deals with identifying the sample sizes and the optimal experimental conditions (both in the screening design and in the design phases). follow-up) for research objectives such as, for example, model discrimination. The areas of application vary from scientific experiments, to the optimization of industrial processes, to clinical and replication studies. Recently, it has been verified that the adoption of the theory of optimal design of experiments is particularly effective for extracting the most relevant information from a Big Dataset. This feature is of interest in machine learning for supervised learning with measurement constraints (i.e., the circumstance for which it is simple and cheap to derive information about predictors, while answers are unavailable and expensive to obtain).
Keywords and topics covered:
D-optimality, A-optimality, I-optimality, sample width, replication studies, data reduction, model selection, discrete choice models, copulation, individualized designs.
People involved:
Federico Castelletti, Guido Consonni, Laura Deldossi, Silvia Osmetti

Research in this field deals with the development of statistical methods for the choice of the best statistical model within a predetermined class of models, for the description of data and relationships between variables. With the advent of Big Data and the great availability of variables that can describe a phenomenon, the problem arises of finding effective methods for selecting the most important ones.
Keywords and topics covered:
Bayes Factor; Computational methods; Objective Bayesian methods; Constrained models; Regression models with g-priors; Computational methods of variable selection
People involved:

Network-based graphical models are used in statistics to estimate causal relationships between variables from observations. Typically, the data-generating network is unknown and is required to be estimated through an inferential process known as "structure learning". The research aims to develop Bayesian methodologies for graph model learning and causal inference in contexts that include: i) observational data; ii) experimental data characterized by groups of individuals subjected to different treatments; iii) heterogeneous data characterized by latent clustering structures. The methodologies developed are used in the medical, both clinical and genomic, and psychological fields, particularly in psychopathological studies.
Keywords and topics covered:
Bayesian inference; causal effect; directed graph; network psychometrics; structure learning.
People involved:
Federico Castelletti, Guido Consonni, Lucia Paci, Stefano Peluso
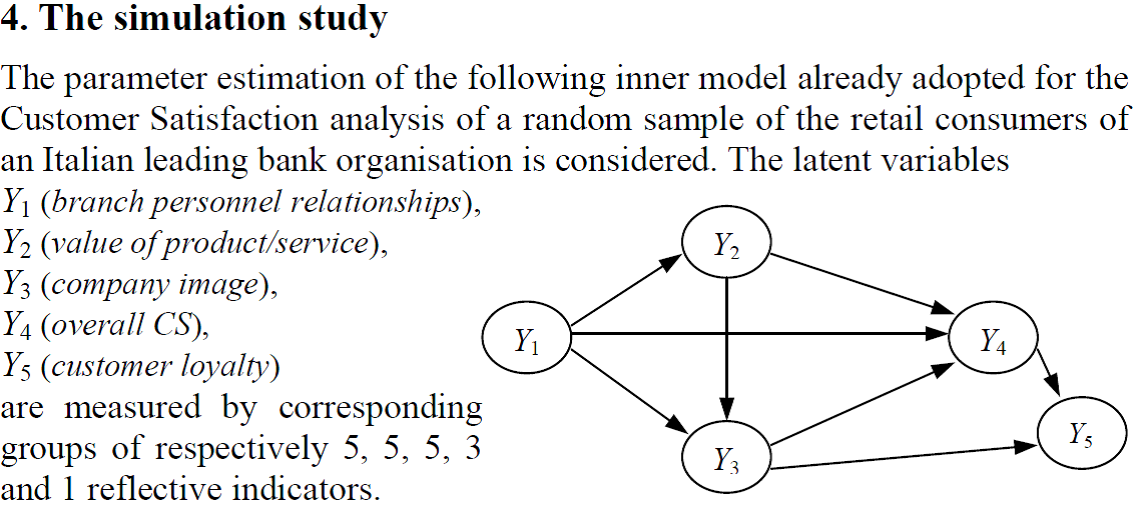
Efficient implementation of the PLS algorithm. Extension of the algorithm in the presence of ordinal variables. Definition of a forecasting method in the presence of ordinal variables.
Keywords and topics covered:
Partial Least Squares; Prediction; Structural equation models
People involved:
Time/spatial series analysis consists of a set of statistical methods designed to investigate the evolution of a data series that varies in time or space.
The applications are vast in all fields of the real world: economics, finance, environmental sciences, ecology, biology, epidemiology, medicine, neuroscience.
Time series analysis is about data collected in a time domain, while spatial data analysis is about statistical analysis of data collected in a spatial domain, such as geographical space.
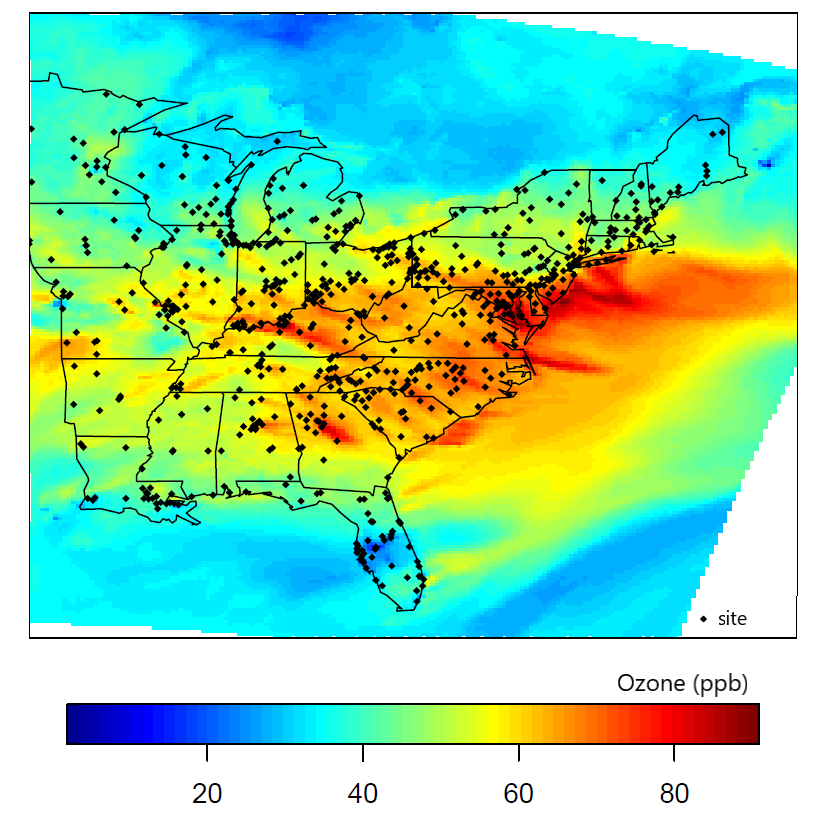
Research in this field deals with the development of stochastic models for inference on the temporal or spatial dependence structure and the prediction of variables of interest for future time instants or in regions of the spatial domain where the data have not been observed. Another objective is to solve the methodological problems that arise in the estimation phase of models and in the testing of hypotheses also in relation to the growing availability of vast amounts of data linked to the diffusion of Big Data and the related computational problems.
Keywords and topics covered:
Spatial Econometrics, Geostatistics, Nonstationary Models, Space-Time Models, Point Processes; Hidden Markov Models: Mixture models; Markov switching models; Autoregressive spatial models, Spatio-temporal panel models, Discrete choice spatial models, Spatial microeconometrics models; Robust Spatial Correlation Measures, Spatial Data Sampling, Spatial Data Steaming, Image Data Analysis, Air and Water Pollution Analysis; Effects of localization errors and geomasking, Applications to the diffusion of Sar-Cov-2.
People involved:
Giuseppe Arbia, Lucia Paci, Roberta Paroli
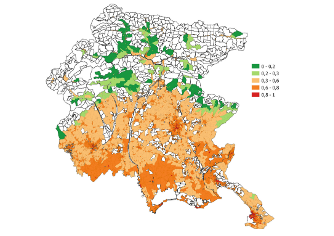
Last decades have seen increasing consensus towards the issue of climate change and rising awareness of the implied responsibility of human activity. With growing global warming, extreme climate events like heat waves have increased in duration, frequency and intensity leading to higher heat-related morbidity and mortality rates. In this context, heat vulnerability assessments play an important role supporting decision-makers in implementing targeted mitigation and prevention actions. With this motivation, this research aims to develop a heat vulnerability index by means of the Composite Indicator techniques to depict heat vulnerability of different geographical areas. In particular, the propsed index is used to map heat vulnerability in the Friuli Venezia Giulia region at the census tract level. The results show that heat vulnerability follows a spatial pattern, where most vulnerable census tracts are located in urbanised and densely populated areas, lower risk is observed in rural areas and lowest danger in mountainous areas. The Performance Interval approach confirms that these results do not depend on the aggregation method used to construct the index.
Keywords or topics covered:
Climate change, Heat waves, Composite indicator, Heat vulnerability index
People involved: